Ready to buy rental properties but unsure how to evaluate the financials? Already own a couple and want to know the key metrics for monitoring performance? Or just need a quick, free way to calculate important metrics on any rental property? Maverick provides the knowledge and tools to confidently evaluate deals and make informed investment decisions.

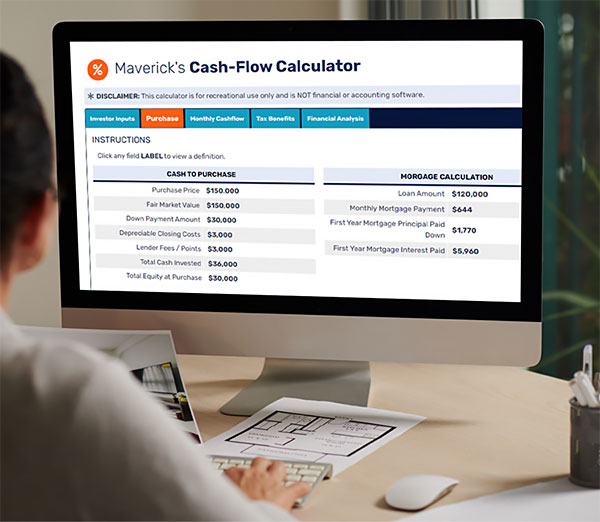
Whether you're looking to make your first investment or just want to learn more about real estate investment analysis and how to use Maverick’s brand new Cash-flow Calculator at no cost, this presentation is for you!
Understand concepts such as Cap Rate, Net Operating Income, Cash-on-Cash Return, and more.
As home prices appreciate and rents rise, learn how to calculate the impact on your investments over time.
Whether you are good at math or not, the following basic calculations are commonly used for real estate investment analysis: Gross Rent Multiplier, Net Operating Income, Capitalization Rate, and Cash-on-Cash Return:
Perhaps the simplest form of real estate investment analysis is the Gross Rent Multiplier which just measures the price to rent ratio.
Let’s say you purchased a property for $125,000 and it rented for $1,300/month, which would be an annual gross scheduled rent of $15,600 (just multiply your monthly rent by 12 to get this).
So, in this example:
GRM = $125,000 / $15,600
GRM = 8
While a price to rent ratio is simple and easy to calculate, it does not take into account your operating expenses. Some markets have much higher property taxes than others for example so to get a more accurate analysis of how much money will go into your pocket, you need to move on to more comprehensive calculations.
Your Net Operating Income (NOI) is your total gross scheduled rent minus all your expenses—property taxes, insurance, HOA fees if any, property management fees, "vacancy" and "maintenance" estimates.
| Gross Monthly Rent | : | $1,300 |
| Property Taxes | : | $120 |
| Insurance | : | $60 |
| HOA | : | $30 |
| Property Management | : | $130 |
| Vacancy Estimate | : | $91 |
| Maintenance Estimate | : | $65 |
|
|
||
| Net Operating Income | : | $804/mo |
A Capitalization Rate (Usually called a “Cap Rate” for short) is simply your annual net operating income divided by your purchase price.
For example, MANY sellers quietly omit the maintenance and vacancy assumptions (which in the example above would change the Cap Rate from a 7.7% to 9.2%, which is a huge difference!). If you were to just compare “cap rates” without confirming how they have been calculated, you would be seriously mis-analyzing the properties. This is why it is crucial for you to understand how these formulas work so that you can apply them yourself when doing your own real estate investment analysis.
Now, even when calculated properly, a cap rate does not take into account any financing you may have used to leverage your purchase. So, the final formula we will discuss here goes one additional step.
So, in this example:
Cap Rate = $9,648 / $125,000
So…
Cap Rate = 7.7%
If you got financing on the property that means that you put less money down out of your pocket and it also means that you have an additional monthly expenses for your mortgage payment (often called “debt service”). You need to be able to analyze the results of this “leverage” and assess how profitable it is for you. The cash-on- cash return formula calculates the return on the total cash invested (which is your down payment plus closing costs plus any other initial expenses) and takes into account the additional “debt service” expense you now have.
So, in our example, let’s say instead of paying cash you purchased this property for 20% down and received an 80% loan at 5% interest with fixed principle and interest payments for 30 years, and let’s say you had a total of $5,000 in closing costs (including lender fees, title fees, etc). On our $125,000 property that means your down payment is $25,000 plus your $5,000 in closing costs so your total cash invested is $30,000. Then if you got an 80% mortgage for $100,000 at 5% interest fixed for 30 years, your P&I monthly payment would be $537/mo (use a mortgage calculator to determine this, or ask your lender), which you then just multiply by 12 to get annual debt service of $6,444. So, in our example:
| Purchase Price | : | $125,000 |
| 20% Down Payment | : | $25,000 |
| Closing Costs | : | $5,000 |
| Total Out of Pocket | : | $30,000 |
| Gross Monthly Rent | : | $1,300 |
| Operating Expenses | : | $496 |
| Net Operating Income | : | $804 |
| Debt Service | : | $537 |
|
|
||
| Net Monthly Cash Flow | : | $267/mo |
Cash on Cash Return = $3,204
(Net Annual Cash Flow) / $30,000 (Total Cash Invested)
So…
Cash on Cash Return = 10.7%
Proper real estate valuation helps you choose better investments and helps you understand whether it’s better to buy, sell, or hold a property that you own or are interested in. Understanding a few of the basic calculations will help you to identify homes that are profitable and offer the best fit for your investment strategy.
We are not a tax professionals, this is not tax or legal advice, and tax laws are constantly being changed and revised and may change the day after you read this. So, this is for informational purposes only, and it is your duty to consult with your own tax professional about your individual situation and the most updated applicable laws before attempting to implement any of the content in this post.
Click on a category and see all of our educational resources available for you:
GET Access TO Private buying opportunities for TURNKEY Rental properies & EDUCATIONAL RESOURCES. READ OUR PRIVACY NOTICE & TERMS OF USE.